.gif)
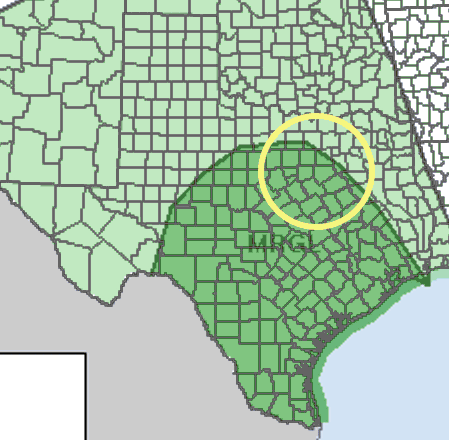
The enlarged view shows a good portion of the DFW Metroplex under the MARGINAL RISK area including Tarrant, Johnson, Ellis, and parts of Dallas county.
Severe weather requires 4 key ingredients: moisture, lift, instability, and wind shear.
Let's look at the ingredients in more detail:
NOTE: All images are taken from the GFS weather model, 06Z initialization on 10/28/15 @ 21Z (4 PM)
MOISTURE
In order for it to rain, you need moisture! For that we can look at the forecast dew points.

This image shows forecast dew points for North Texas in the low to mid-60s - which is plenty of moisture in the atmosphere for severe weather.
LIFT
The jet stream is a fast-moving "river" of air in the upper atmosphere which impacts our weather. The shapes the jet stream can take are a result of high and low pressure areas. A trough is a large U-shaped structure in the jet stream which indicates a low pressure area - generally responsible for poor weather. When wind approaches a low pressure center, it tends to slow down around around the center region, then quickly speed up and eject out of it. This image is taken from the GFS weather model and shows the predicted winds at 500 mb (millibars - a measure of pressure) or about 18,000 feet up.

The U shape is clearly visible west of Texas and the winds ejecting from it are sailing directly over us. This creates lift in the atmosphere by a process known as upper level divergence. An oversimplified example of this is a line of cars accelerating at a green light. As the cars begin to speed up, the distances between them gets larger. In the atmosphere, when the wind "diverges" high up, winds from below are lifted up to fill those "gaps". Lift helps to raise air up so it'll cool, condense, and rain.
INSTABILITY
Instability is a measure of the tendency of air to be lifted. This is highly dependent on temperature and moisture. If the temperatures above us don't cool down in fast enough going up in to the atmosphere, this impedes surface air from wanting to rise. In this case, we say the air is stable. If air is unstable (a higher instability number), air will have a tendency to rise. This chart shows a forecast sounding (a vertical temperature and moisture profile) for central Hill County on Friday at 4PM.

Note the blue line. See how it doesn't go very far to the right of the red line, if at all? At a very basic level, this means that there will not be a large amount of instability in the atmosphere. This factor alone is a large reason why the severe weather chances are low. If that blue line were much further to the right - creating a large space between itself and the red line, severe weather chances would most certainly increase. But again, this is a forecast weather model and not a direct measurement (it's in the future keep in mind), so things are of course subject to change.
WIND SHEAR
Wind shear is a change in wind speed (speed shear) or direction (directional shear) with height. In other words, winds at the surface tend to change direction and/or speed the higher you go in to the atmosphere. It's not uncommon to have winds coming out of the south or southeast at ground level and winds coming from the west at 500 mb (18,000 ft). Wind shear plays a large role in the longevity and strength of severe storms.
To get a good look at wind shear, we can use a something called a hodograph which plots wind speeds in a certain way on a circular graph. The shape of these wind speeds can give a good indication of the type severe storm and even if the possibility of tornadoes exists.
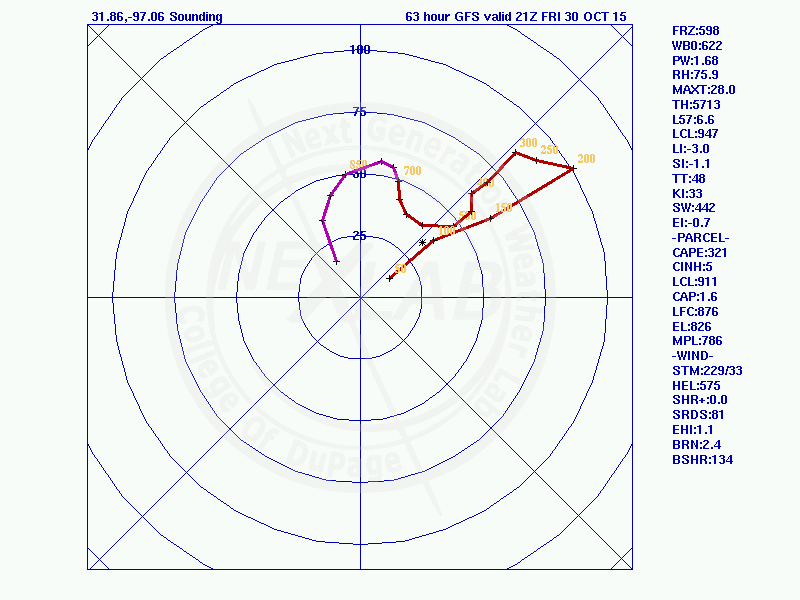
Without getting into all the nuts and bolts, the key thing about this image is the large circular shape in purple. This is the graph of the forecast lower level winds. The strength and shape of this curve indicates that at this time, (assuming that all other ingredients come in to play) that tornadoes are possible. Keep in mind that A LOT has to go right for tornadoes to develop - much the same way that in addition to flour, lots of ingredients have to come into play to make a cake.
As I mentioned before, this is just one slice on information from one specific weather model and is NOT meant the be an authoritative forecast. In fact, this is probably wishful thinking on my part and are a result of me wanting to chance some storms! While the wind shear, lift, and moisture look promising, the lack of instability may turn this whole event sour. Regardless, let's see how these ingredients shape up and keep an eye to my Faceook page for more up-to-date info!
-Andrew
No comments:
Post a Comment