Thursday, May 8, 2014

Doppler Radar -So Many Colors, So Much Information

One of the things that really got me interested in weather was Doppler Radar.  I was fascinated with how radar could tell meteorologists about what was happening outside - simply by looking at colors on a screen.  Of course radar isn't the only tool in the meteorologist toolkit, but it is one of the strongest and most important.  The current generation of radar used today by the National Weather Service (NWS) is the WSR-88D.  This stands for Weather Surveillance Radar - 1988 Doppler.  The NWS (and other agencies including NOAA and the Department of Defense) operate some 164 radar sites throughout the continental US, Hawaii, Alaska, Puerto Rico and Guam.

Doppler radar works on a very simple principal - "speaking" and "listening".  In essence, the radar "speaks" by sending out pulses of electro-magnetic energy (microwaves) to some target.  Most of that energy is scattered, but a small portion is reflected back to the radar site where it is "heard".  The amount of returned data (e.g. how loud the echo is) is called "reflectivity" and is measured in units of decibels of Z or dBZ.    This VERY basic example is done thousands of times per second at the speed of light.  In fact, a WSR-88D radar is "speaking" for just about 7 seconds per hour and the remaining 59 minutes, 53 seconds is spent "listening" for any returned signals.  Because we know the speed at which these signals are sent (the speed of light) and the time it takes for the signals to return (and something else called a Phase Shift) we can also determine if an object is stationary or moving towards or away from the radar and the speed its moving .  Isn't math AWESOME?? 

Let's take a look at what reflectivity and velocity look like in real-world examples.  Here is a screen shot of a supercell thunderstorm approaching Oklahoma City on May 7, 2014.  The left pane is showing reflectivity - or the intensity of the echoes being returned to the radar.  The right pane is radial velocity - showing winds blowing toward the radar (GREEN) or away from the radar (RED).  While these two different views are looking at the same space and time, the information they show is vastly different. The full resolution image can be found here.


Let's zoom in on reflectivity...(full resolution)

 
In reflectivity mode the color scale is completely arbitrary, but it's generally agreed upon that warmer colors indicate higher reflectivity and cooler colors indicate areas of lower reflectivity.  Using that model, we can see that cities like Spencer, OK and Mustang, OK are getting this heaviest precipitation, while cities like Piedmont, OK and Bridge Creek, OK are getting very little precipitation.
 
 
In velocity mode, keeping in mind that green indicates winds blowing toward the radar and red indicates winds that are blowing away from the radar, we can clearly see that the area by Bridge Creek has winds blowing "inbound" and by Tuttle, the windows are blowing "outbound".  This is actually an area of broad circulation that should be watched as it could potentially tighten in turn into a tornado.
 
Here's a close up of that area with the wind directions annotated.  With the arrows present, the rotation becomes much more apparent.


Reflectivity and Velocity products are very adept at telling meteorologists what is happening - however, they're lacking in some critical information.  However, in 2013, a major upgrade to the network of WSR-88D's was completed.  This "Dual-Pol" upgrade (short for Dual Polarization) gave meteorologists a number of new tools to help identify more accurately what the radar is "seeing".  Before the upgrade, the beam that the radar was sending out was only polarized in one direction (let's say horizontal).  Therefore, the radar could only measure the width something it hit, not the height.  Thus, critical information about the type of precipitation was lacking.  Think of it this way:  When a rain drop is falling, it's not perfectly spherical.  Because of the effects of air resistance, a rain drop will actually become oblate.  I like to think of this as a hamburger bun shape.  The bigger the rain drop, the flatter (or wider) it becomes as it falls.  Let's then contrast this with a hail stone of the same width.  Even though both objects may be similar in width, they are not the same in height.  The rain drop has a much narrower dimension vertically.  A hail stone (a sphere in this basic example), has roughly the same dimensions vertically and horizontally when falling.  Therefore, a single-polarized radar beam had trouble distinguishing between rain and hail.

Enter DUAL-POL.  Like I stated before, this stands for Dual-Polarization.  This means that the radar can "see" in both the horizontal AND vertical dimensions.  Using the example above, a large rain drop will be wider than it is taller when falling.  Hail will be roughly spherical in shape when it falls.  Therefore, the difference between the vertical and horizontal measurements of  the target can now be better distinguished and more easily identified.  This "differential reflectivity" is a major benefit to the dual-polarization upgrade as meteorologists can get a better idea if an area of a storm contains heavy rain as opposed to hail.  This new set of information can better assist meteorologists in the warning decision process by refining areas of more severe weather.

One other important benefit of this dual-polarization upgrade is the ability to determine how similar targets are in size and shape.  For example, if in a given scan, all of the targets are roughly the same size and same shape, one can infer that the precipitation is homogeneous.  Areas of rain only, can now be distinguished from areas of rain AND hail mix.  This product is called "Correlation Coefficient".  There are other, more technical, products that the dual-polarization upgrade offers, but for this article, I'll leave them out. 

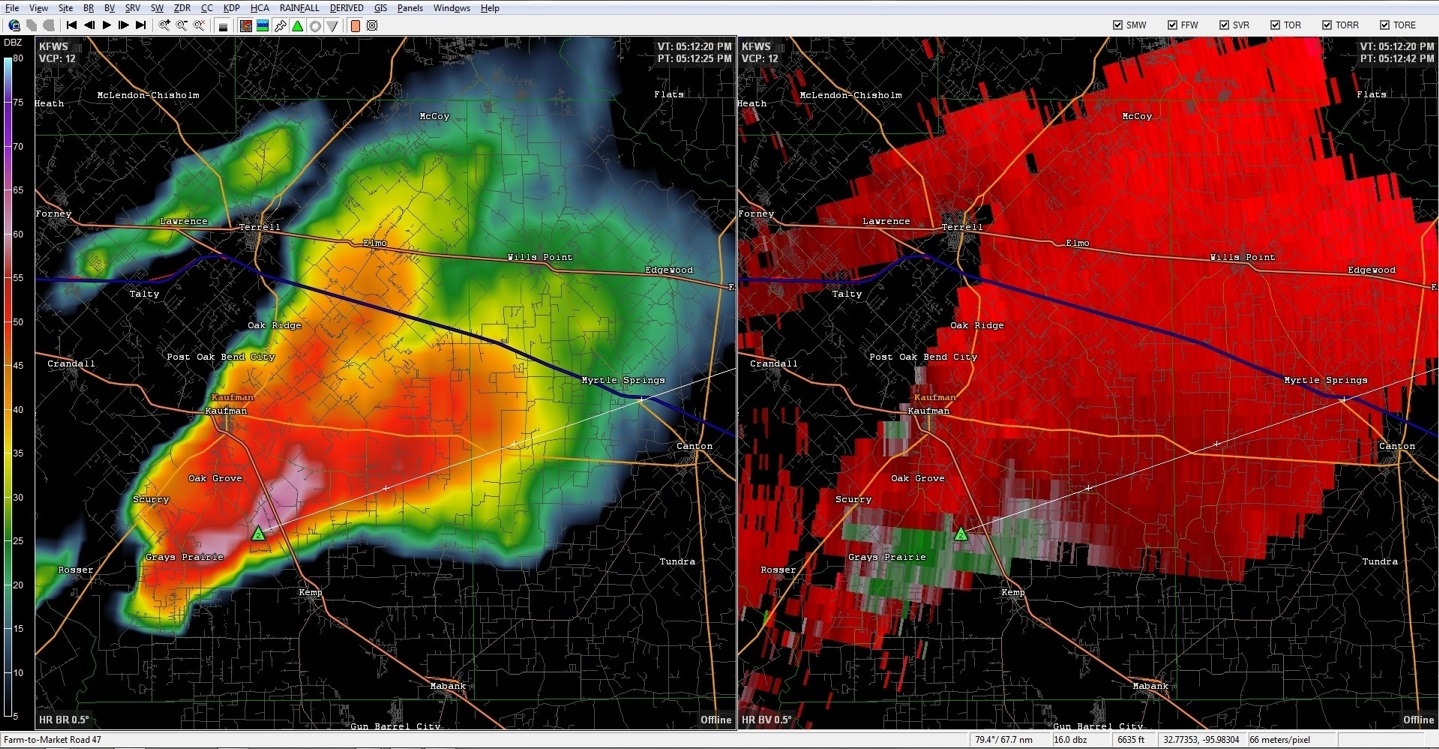
So, big deal, right?  What's all the fuss?  Let me wrap it all up by showing one last example.  The screen shot below was taken on April 28, 2014 from the KGWX Doppler Radar near Columbus Air Force Base in Mississippi.  The full resolution image is here.


This 4-pane view is looking at the same area in both space and time, but is displaying vastly different data.  The upper left corner, is radar reflectivity.  The upper right is radial velocity.  The lower right is something called storm-relative radial velocity.  This is similar to radial velocity, but it displays the speeds of the winds with the motion of the storms subtracted.  This helps to identify movement of winds within a storm without having the storm motion factored in.  Lastly, the lower left pane is the correlation coefficient product - one of the new dual-pol upgrade products.

Reflectivity


One key feature that this image of radar reflectivity shows is a distinct "hook echo" shape.  I've annotated this in the following image.  See how the rain wraps around in the shape of a hook?  While this hook shape is certainly interesting, on its own, it can't give us the full picture of what's really going on.


Velocity


The velocity view, again, shows winds that are blowing toward (GREEN) and away (RED) from the radar.  In this example the radar site is located well BELOW the image.  This is important to know as inbound and outbound winds are measured relative to the radar site.   See how in both images, you have reds and greens very close together?  This is a very good indicator that there is very strong rotation present.  The closer and brighter the colors are together, the stronger and tighter the winds are.  Here's an annotated view:


Up to now, we have a pretty good indication that there is something major going on.  However, we cant be 100% certain as we're not present to witness the actual event.  Let's add the last component to see if we can get a full picture.

Correlation Coefficient

 
Again, this product looks at how similar in size and shape the precipitation is.  For the most part, the reds and purples tell us that, yes, what we see from the reflectivity view shown earlier is just rain.  The yellows and oranges shown near the top are probably hail.  However, the main focus of this image is that large, gaping hole in the middle.  See that blue section?  This is where "similarness" of what the radar is seeing drops down dramatically.  If you were to superimpose this image directly over that of the velocity data, the areas where the winds are coming together and this blue area are exactly lined up.  In this example what we're seeing is a tornadic debris ball.  This is "stuff" that a tornado is picking up and lofting into the air.  It could be houses, it could be vehicles, it could be trees, bushes or farm animals.  Regardless, this tornado was not just radar indicated, but verified by storm spotters.  This debris ball signature could not be possible with out the recent dual-pol upgrade.
 
The dual-polarization upgrades not only were time-intensive, but they were also costly - about $50 million dollars in all.  However, the wealth of new information that this technology has given and the better ability of meteorologists to improve the warning process, in my view, justifies the cost.  While meteorologists never rely on radar data alone in the warning decision process, important upgrades like dual-pol help to verify and substantiate reports from the public and most importantly save lives.

-Andrew


Saturday, May 3, 2014

An Autopsy of My Second-Ever Storm Chase

Sunday, April 27, 2014 was forecasted to be a potentially bumpy day a far as weather goes in North Texas.  The Storm Prediction Center (SPC) 13Z (8 AM)  Day 1 Outlook put Waxahachie in the Slight Risk category for severe weather:


Thinking that this was going to be your typical "wait for the heat of the day to build up and produce storms in the afternoon" kind of day, we all got dressed and went to church.  Before we left, I checked the morning sounding and was a bit discouraged.


A sounding is a way to get a look at the cross section of air from the ground all the way up into the troposphere.  Around the country at various National Weather Services offices  a weather balloon is launched twice a day - once in the morning and once in the evening.  Attached to the weather balloon is an instrument called a radiosonde.  This device measures temperature, moisture (dew point), wind speed and direction.  When plotted on a graph called a Skew-T Log P Diagram, you get the above diagram.  The red line on the right is the temperature plot and the green line is the dew point.  See how at just above the 1 km level the temperature goes UP and the moisture goes DOWN?  This is known as a CAP, or temperature inversion.  This prevents parcels of air from rising and, thus, growing into thunderstorms.  Given enough energy, the cap can be broken, but many times a strong cap (like the one above) means that storms have little chance of forming.

Back at church - about 9:15, just as the kids were getting settled into their Sunday school classes, it began to get quite dark outside.  Not wanting to miss anything, I repeatedly went outside to stare into the sky.  I'm sure I looked quite foolish. 

Five minutes later a line of storms that I later found out was caused by gravity wave and a surface trough that preceded a dry line swept through the area.  They fired up quite quickly and produced some pea to dime sized hail!

 
After 5 minutes of rain, the skies cleared up and it was blue sky as far as the eye could see!   Was this it?  Was this the "Slight Risk" that the SPC has been warning us for days in advance?  Needless to say, the elation of being in a good hail storm quickly turned to frustration.
 
That afternoon, as the kids played outside, the mundaneness of Sunday afternoons was in full effect.  I had just begun to plan that week's grocery list when the kiddos mentioned that they heard thunder.  I brushed it off saying, "Yes, it's probably far away..." and went back to my grocery list.   Luckily, I had my radar program up and running and much to my surprise, I see some activity building up to our southeast!
 
Although I didn't realize it at the time, a cold front had been approaching from the west.  A "front" is a boundary between two different air masses.  The air in my area was warm and moist, but the air behind the front was cool and dry.  When cool air pushes under warmer air, this can cause lift in the atmosphere and thus contribute to the development of thunderstorms.  To illustrate this, look at the following 3 radar snapshots:
 
 
The radar that the National Weather Service uses is sensitive enough to show fronts, given the right conditions.  The "stuff" that the radar is seeing may be dust or insects that are being blown by the front itself.  The front on this day was clearly visible - denoted by the red arrows.  This snapshot was from 2:27PM.
 
 
An hour later, at 3:27 PM the front was progressing eastward and small thunderstorms began to show up on radar.  In other words, the cold air behind the front was pushing underneath the warmer and moister air ahead.  This pushed UP the warmer air into the atmosphere where it was less buoyant that air around it.  As a result, it continued to rise and give way to storms.


By 4:11 PM, the front was directly over Waxahachie and there was some major development happening to our southeast.  Radar was already indicating that there was 1" hail around 2500 feet above the ground.  It was around this time that the kids noted they heard thunder.  I finished up what I was working on, stepped outside and saw this awesome sight.  (full pic here)
 
 
I could tell that this wasn't your ordinary thunderstorm!  The size and shape was screaming SUPERCELL!  At the time this picture was taken (about 4:26 PM), the National Weather Service had already issued a severe thunderstorm warning.  The blue shaded area to the east indicates that a severe thunderstorm watch had already been issued.


I jokingly said to my wife that we should go chase the storm since it was so close.  Much to my surprise, she said, "Sure, let's go!"  So my wife, 4 out of my 5 kids and I all jumped into the car and headed south on US 287 to chase!
 
The structure of this storm was crazy!  It's really something to see that big in person.  It is almost surreal to watch it transform right in front of your eyes.  These next 3 shots are over the course of just 4 minutes.


I knew from my storm spotting classes and all the research I've done on storms and storm chasing that the best (and usually the safest) place to be is on the rear-right flank of the storm.  This position typically allows for best viewing.  Keeping this in mind, we kept the storm at our left and attempted to stay south and east of it. 
 
We got to Ennis, TX and headed south on I-45 for a mile or to and ended up taking FM85 East.  This is a pretty windy road but generally heads east.  We had been on this very same road a few weeks ago to check out the bluebonnets, so I was fairly familiar with it.  The problem was that although we were headed generally east - the storm was tracking northeast.  This meant that as time went on, the storm was getting further and further away.  I didn't have my computer's radar program with me at the time - which was making me a bit uneasy. I only had my phone's radar app and Google maps - both very good tools, but a bit hard to use when you're trying to intercept a storm!  The radar program indicated that the there was some broad circulation near the back of the storm.  This area is where tornados usually form.  I wasn't expecting a tornado by any means, but this was certainly the area that I wanted to focus on.
 
With the storm getting further and further away, I knew that we needed to head north.  About 7 miles west of the town of Seven Points, we turned north onto FM2613.  It soon became clear that this was a great choice!  As we continued north, we could begin to see the backside of the storm.  The base of the storm was still pretty high up (this is one indication of a lower tornado threat).  However, saw what I thought was a pretty-well defined wall cloud. A wall-cloud is a lowering in a base of a thunderstorm and is the area where a tornado would form.  This section of the storm has no rain associated with it (an area technically called a rain-free base) and is the part of the storm that contains the largest updrafts.  Although there was broader circulation with the whole storm, I didn't see that this wall cloud was rotating.  We found a place to stop and I snapped this:
 
 
By this time, my adrenaline was pretty high.  After all this was really only my second storm chase and being out in the field is entirely different than all of the textbook diagrams and charts that I had been pouring over in the months past.  For a moment, I hesitated.  What this really a wall cloud?  Maybe it was something else altogether.  After going back and forth a few times in my head, I made the decision to call in a report to the local National Weather Service.  To this day, I'm not sure they received the report.
 
We followed the storm into the town of Kemp where we ended up stopping to get gas.  Realizing that it was about dinner time and we had the kiddos with us, we got snacks for them too.  They were overjoyed at this!  As we were filling up, I snapped this from my radar app.


With snacks in had and gas in the car, we continued to chase the storm NE.  We made it as far as Canton before  we decided to call it quits.  Although we would have liked to continue, we had already missed a deadline to pick up our oldest daughter and needed to get back home for that.  The storm already had gotten quite a bit ahead of us, so I was looking like a lost cause.  But all wasn't lost!  After all only being out for the second time, we did end up seeing a wall cloud and calling in to make a report.  I'd call that success!  But as we were driving home, I couldn't help but go over the chase in my head.  Did I make the right call by calling in the report?  Was it really a wall cloud that we saw?  I tried not to let all these nagging questions get in the way of the smile across my face.
 
Fast forward half a week and I decided to try to pull up some historical Level III radar data to see if I could analyze what it was we saw.  Data from all the WSR-88D Nexrad Radars are archived and can be pulled up at any time.  I found the time frame I needed and proceeded to import them into my desktop radar program.  What I found out was nothing less than spectacular.
 
 
The time stamp on this frame of radar data is 5:12 PM - which is EXACTLY the same time that I had photographed what I thought was the wall cloud.  Looking that this view proves a few things to me.  1) This storm was indeed a supercell.  The shape of the reflectivity data (the view on the left) is nearly a classic-textbook shape.  2) This storm did have some broad rotation as indicated by the red/green colors in the pane on the right (Green colors show winds that are blowing toward the radar and red colors indicate winds that are blowing away from the radar).  I zoomed in further, added some annotations, and everything began to fall into place.  Here is the final product.  A larger view can be seen here.
 
 
This picture shows my position relative to the storm.  The yellow lines are my approximate field of vision and line up exactly where a wall cloud should be.  This, without a doubt, proves that what I did see was, in fact, a wall cloud!  Not too bad for my second-ever chase.
 
In the future, I may not be able to construct each chase in this level of detail, but I hope to be able to see (and document) some pretty wild weather.
 
-Andrew