Monday, February 23, 2015

A Winter Storm in North Texas Brings Thundersleet!

The National Weather Service did an exceptional job forecasting a winter storm for the North Texas area over the last number of days.  The primary hazards for this event were forecast to be freezing rain and sleet accumulations (as well as a phenomena known as thundersleet).  As of 7 AM on Monday, February 23, 2015 (the day of the event), we already had approx. 1/4" of sleet accumulated at my house in Waxahachie, Texas


Forecasting winter weather is extremely tricky as there are MANY variables which come into play.  Temperature fluctuations by a degree or two can have a huge impact on the amount and type of precipitation that may fall in a given area.  This graphic, courtesy of the National Weather Service, briefly explains the differences in winter precipitation.

 
As sleet was falling around the majority of the Metroplex today, let's take a closer look at the atmosphere and see why this was so.  To this end, let's bring up the sounding for the DFW area.
 
 
As I've eluded to numerous times in previous posts, a sounding is a graphical representation of the cross section of air starting at the surface and going as high as 15 km.  The red line represents the observed temperature and the green line is the observed dewpoint.  Also plotted (but not as important for this post) are wind speed and direction.  Due to the proximity of the red and green lines in the bottom half of this sounding, it's reasonable to assume that there is some kind of precipitation going on. Why?  When the temperature of air drops to the dew point, the air has cooled sufficiently to condense the water vapor present into water.
 
 
This next picture is zoomed into the bottom 9 km of the atmosphere.  I've also noted (in light blue) the 0 degree temperature line.  Note that this line isn't straight up and down - rather it's skewed to the right.  Incidentally, this is why this diagram is also called a Skew-T (skewed temperature).  This line becomes vitally important when looking at winter precipitation! 
 
Starting at the 6 km altitude and moving downward, the sounding can be looked at in 3 sections.  This will help us trace the precipitation path and determine its type.
 
6 km -3 km:  This layer is most certainly precipitation as the temperature and dew point lines are nearly on top of each other.  However, because all of this layer is below freezing (to the left of the 0 degree line), the precipitation being generated is most likely snow.
 
3 km - 1.5 km:  The temperature and dew point lines are still very close which indicate precipitation.  But this time, the entire layer is to the right of the 0 degree line.  In other words, any snow falling through this layer is warmer than freezing and thus would be melting.
 
1.5 km - surface:  As the water droplets continue to fall from a height of 1.5 km, the temperature once again drops back below freezing.  Due to the thickness (height) of this layer, it seems likely that there's sufficient time for them to refreeze into sleet (ice pellets).  If this layer had not been as deep, the next likely precipitation type would have been freezing rain.
 
 
A relatively rare phenomenon known as thundersleet also occurred today.  Thundersleet is nothing more than sleet coming out of a thunderstorm.  But how can there be thunderstorms when the surface temperature is below zero?  In order to have a thunderstorm, you generally have to have 3 ingredients:  moisture, instability and lift.  I've already gone over the moisture component, so let's talk briefly about stability.  Stability is a measure of the atmosphere's tendency to encourage or not encourage vertical motion. Let's take another look at the DFW sounding from this morning: 


I've outlined what is known as a stable layer of air.  Look at how the temperature rises with height.  In other words, the air is getting warmer the higher you go within this layer.  This means that air in the lower portions of the layer are colder and will not have a tendency to rise.  This is called stable air.   Above the stable layer, the temperature decreases with height.  When you have cooler temperatures above and warmer air below, air has the tendency to rise and is therefore called unstable air.  (Technically, this is called conditionally unstable air but there this should suffice for this post).  As thunder comes about from convective (i.e. rising/sinking) motions of air, all thunderstorm activity would have to originate above this stable layer. 

With me so far?

The last thunderstorm ingredient - lift -  is a bit more complicated.  In order to get parcels of air to form into thunderstorms, you need some kind of lifting mechanism.  Typically this can be in the form of cold front or warm front.  For this article, the lifting mechanism isn't important.  However, the key is to look at the parcel after it has been lifted to see if it now stable or unstable. 

I'm going to focus on the section above the stable layer as noted previously.

 
I've zoomed into this section of the sounding using another website.
 
 
What's cool about this website is that you can "lift" a parcel of air simply by clicking somewhere along the temperature curve.  When I did this at a particular height (482 mb*), something interesting showed up.
 
(*mb refers to millibars - or atmospheric pressure - which is directly related to height in the atmosphere.  The lower the millibar number, the lower the pressure and thus the higher in the atmosphere.)
 
 
When a parcel of air at the 482 mb level is lifted it technically becomes warmer than it's environment.  Remember then what happens?  It rises!  It is this convective process that leads to storms and thunder!  The lifted parcel's temperature is shown as the purple line in the image above.  See how the parcel is warmer than the environmental temperature (red line)?  This means that all along this pacel's ascent path it's rising due to the instability of the air.  It eventually meets up again with the environmental temperature at which time it would stop rising.  The area between the purple and red lines is called CAPE (Convective Available Potential Energy) and is a measure of how strong a thunderstorm can be.  In this particular example, the CAPE value wasn't very strong and thus the thundersleet was not very widespread.  It's also interesting to note that the 482 mb level wasn't the only height which generated CAPE values.  There were other lotions where CAPE was present, but at lower amounts. 
 
 
This was the end product of all the processes I've just discussed: Lightning (and thunder) as a result of elevated thunderstorms which produced snow that melted as it passed through a warm layer of the atmosphere and ultimately refroze while going through a subfreezing section of air before hitting the ground as sleet.


Monday, February 9, 2015

When Something In The Sky Seems Odd

File this post under miscellaneous drivel.

I am a very habitual person.  When I get into a routine, it's hard for me to break it.  Ever since getting into meteorology, I've gotten into the habit of checking the morning and evening soundings for the DFW and surrounding areas.  Soundings can show a great deal about the vertical makeup of the atmosphere.  Here are the morning soundings for today - February 9, 2015.


As the pictures indicate by the wide spacing between the red (temperature) and green (dew point) lines, the air in the DFW region is very dry - much too dry for clouds to form.  However, when I picked up my oldest daughter from theater practice tonight, I noticed this to my north.
 
 
The whole time I was looking at this, I kept thinking to myself, "This shouldn't be there.  What's going on?"  I also couldn't get over that distinctive arrowhead shape.
 
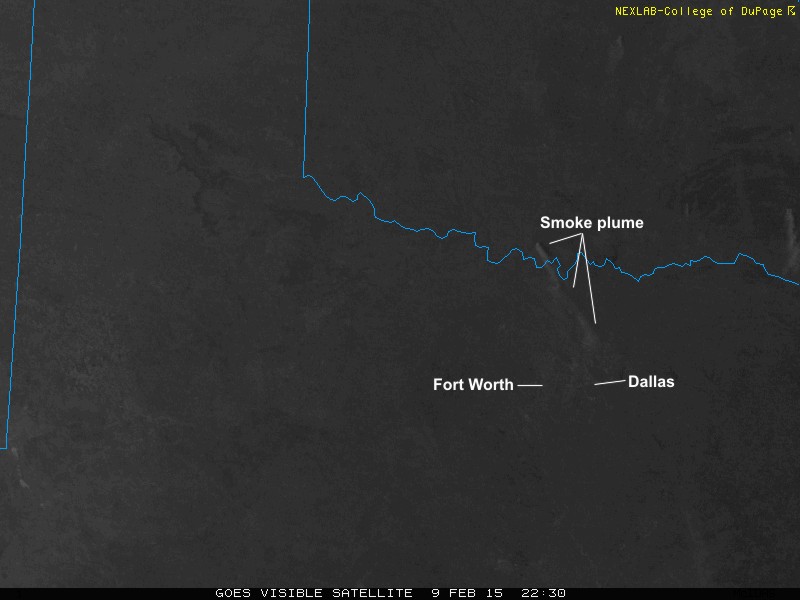
When I arrived home, I pulled up the 1KM visible satellite feed and got the answer to my question.  The "cloud" wasn't really a cloud at all, rather a smoke plume from southern Oklahoma - originating some 115 miles away!
 
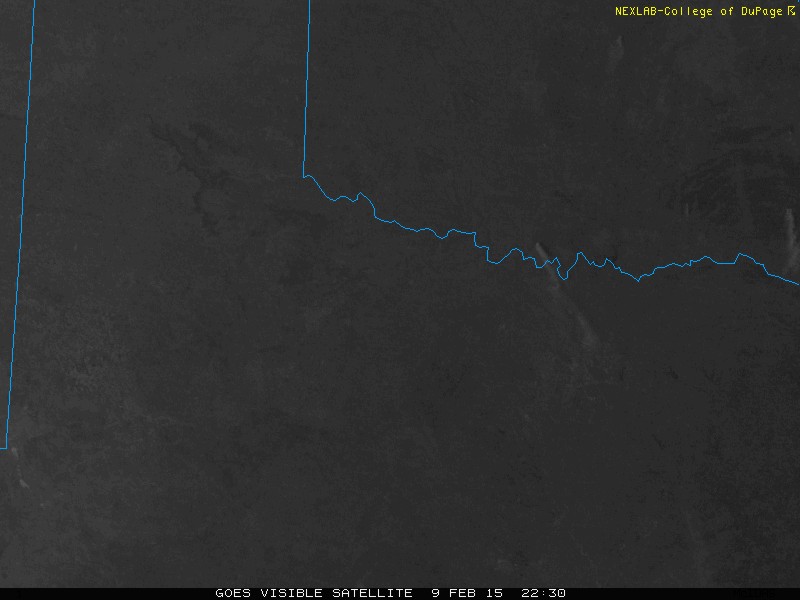
This was the visible satellite image from 2230Z (5:30 PM CST)
 
 
The squiggly blue line running west to east is the Red River, which is the border between Texas and Oklahoma.  About midway though the Red River is a white/gray plume of smoke running from the northwest and blowing southeast.  Here's another view to give you an idea of scale.
 
 
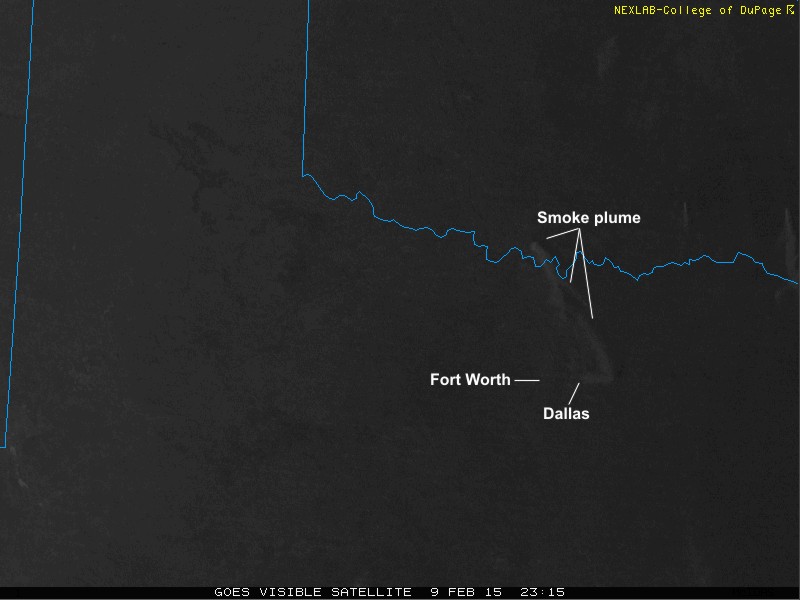
The image from 45 minutes later - (2315Z, or 6:15 PM CST), showed from above exactly what I had snapped from ground level. 
 
 
Easily visible in this image is that same arrowhead shape that I had seen from below.  When running the animation loop of the visible satellite feed, I noticed that this wasn't the only fire in Oklahoma today - but this was certainly the most prominent.  In other parts of the state, I read that the forest service were doing controlled burns in some of their forest preserves.  There didn't look to be a forest preserve near the origin of this fire so I'm not entirely sure of the cause.  So, while not earth shattering, I thought it was kind of cool to correlate a photo taken on the ground with an image from a satellite orbiting roughly 22,000 miles above the ground!!


Can't We Get Rid of This Persistently Nice Weather?

Am I going crazy?  Why would anyone want to get rid of such nice weather?  Surely I must be joking, right?  Well, yes and no.  While I do enjoy nice sunny days, I very much long this time of year for the excitement of the spring storm season.  The clean, dry air of high pressure days, while pretty, just doesn't do it for someone who always is looking at the clouds.  A quick view of our extended forecast for North Texas puts daytime highs in the 60s and 70s - with only a few days mixed in with very low precipitation chances.  Boo!  (Can you feel the sarcasm dripping from this post??)

As it turns out, I actually can blame this weather on something:  a Rex Block

Who is Rex Block?  Well, a Rex Block isn't a who, but a what.  This is a meteorological term for a specific type of blocking pattern.  Blocking patterns are relatively stationary weather patterns that block other systems from coming through.  The Rex Block is a special type of blocking pattern in which an upper level center of low pressure is situated directly southward of an upper level high pressure center.  It was named after Dr. Daniel F. Rex who named this pattern in 1950.  Here is an idealized diagram:

Winds from the west encounter the high pressure area and begin to flow clockwise around it, then start to flow counter-clockwise around the low pressure area.  In other words, the winds blow in a backwards S pattern from north to south.  As there little west-east flow, this pattern can persist for days.

Here's what our current weather pattern looks like.  This image is taken from the NAM weather model.  It shows the 500mb weather patterns (winds at around 18,000 ft. above the ground).

 
There's a few features that I need to point out so that all of this makes some sense.  I've added a large, blue H over northern Mexico.  This (as I'm sure you've seen countless times on other weather maps) is an area of high pressure.  High pressure generally gives clear skies and dry air - exactly what we have today. Also, take a look at the solid black lines.  See how they make patterns that look like a large right-side up and upside down U?  Now look at how Texas is west of one of these U-shaped features.  Generally speaking, the western side of the U tends to have sinking air (i.e. high pressure) and fair skies, while the eastern side of these U shapes generally have rising air (low pressure) and cloudy skies.  
 
The large, red L is of course a low pressure area - responsible for clouds and rain - exactly what is happening in Washington and Oregon today.
 
As the NAM continues over its 84-hour forecast period, it shows the low swooping down from the Pacific Northwest, but then starts to retrograde (or move westward) and finally positions itself on the north end of the Baja Peninsula, directly southward of another high pressure ridge.  This pattern now forms the classic Rex Block.  Here's the 84-hour forecast NAM view.
 
 
You'll notice how Texas continues to be generally westward of one of those U shapes.  Again, this region generally has sinking air and fair skies.  When you add the effects of the Rex Block, it's going to ensure that we have clear sailing for a long time to come.  The GFS weather model also shows a Rex Block for the same time period (roughly 84-hours out).  However, because the GFS forecasts out to 240 hours, it also shows that we could be in for a nice change (and by that I mean RAIN) by early next week. 
 
Until then - enjoy the weather!