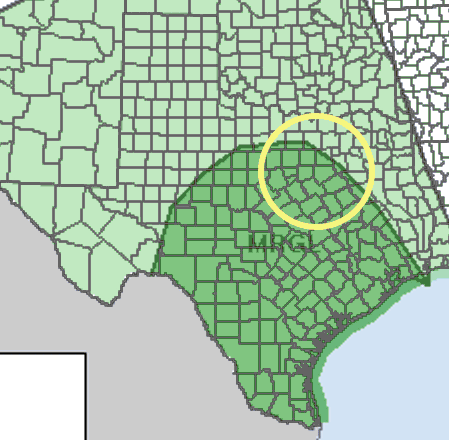
I'm going to preface this post by saying that I'm NOT a weather forecaster, nor do I pretend to be one. However, in my self-study of weather, I've noticed certain ingredients that when added together in just the right amounts can make for some unsettled weather. The problem is of course is that the weather is ALWAYS changing and what looks good today, may not look good when the time comes. Here's what I'm mean. Confidence is increasing that Friday, October 30, 2015 will be another rainy day for North Texas. However, there is a chance, albeit low at this time, for severe weather. This is the SPC Outlook for Day 3 - Friday, October 30, 2015. Already, some parts of north Texas are shown in the MARGINAL RISK area.
The enlarged view shows a good portion of the DFW Metroplex under the MARGINAL RISK area including Tarrant, Johnson, Ellis, and parts of Dallas county.
Severe weather requires 4 key ingredients: moisture, lift, instability, and wind shear.
Let's look at the ingredients in more detail:
NOTE: All images are taken from the GFS weather model, 06Z initialization on 10/28/15 @ 21Z (4 PM)
MOISTURE
In order for it to rain, you need moisture! For that we can look at the forecast dew points.
This image shows forecast dew points for North Texas in the low to mid-60s - which is plenty of moisture in the atmosphere for severe weather.
LIFT
The jet stream is a fast-moving "river" of air in the upper atmosphere which impacts our weather. The shapes the jet stream can take are a result of high and low pressure areas. A trough is a large U-shaped structure in the jet stream which indicates a low pressure area - generally responsible for poor weather. When wind approaches a low pressure center, it tends to slow down around around the center region, then quickly speed up and eject out of it. This image is taken from the GFS weather model and shows the predicted winds at 500 mb (millibars - a measure of pressure) or about 18,000 feet up.
The U shape is clearly visible west of Texas and the winds ejecting from it are sailing directly over us. This creates lift in the atmosphere by a process known as upper level divergence. An oversimplified example of this is a line of cars accelerating at a green light. As the cars begin to speed up, the distances between them gets larger. In the atmosphere, when the wind "diverges" high up, winds from below are lifted up to fill those "gaps". Lift helps to raise air up so it'll cool, condense, and rain.
INSTABILITY
Instability is a measure of the tendency of air to be lifted. This is highly dependent on temperature and moisture. If the temperatures above us don't cool down in fast enough going up in to the atmosphere, this impedes surface air from wanting to rise. In this case, we say the air is stable. If air is unstable (a higher instability number), air will have a tendency to rise. This chart shows a forecast sounding (a vertical temperature and moisture profile) for central Hill County on Friday at 4PM.
Note the blue line. See how it doesn't go very far to the right of the red line, if at all? At a very basic level, this means that there will not be a large amount of instability in the atmosphere. This factor alone is a large reason why the severe weather chances are low. If that blue line were much further to the right - creating a large space between itself and the red line, severe weather chances would most certainly increase. But again, this is a forecast weather model and not a direct measurement (it's in the future keep in mind), so things are of course subject to change.
WIND SHEAR
Wind shear is a change in wind speed (speed shear) or direction (directional shear) with height. In other words, winds at the surface tend to change direction and/or speed the higher you go in to the atmosphere. It's not uncommon to have winds coming out of the south or southeast at ground level and winds coming from the west at 500 mb (18,000 ft). Wind shear plays a large role in the longevity and strength of severe storms.
To get a good look at wind shear, we can use a something called a hodograph which plots wind speeds in a certain way on a circular graph. The shape of these wind speeds can give a good indication of the type severe storm and even if the possibility of tornadoes exists.
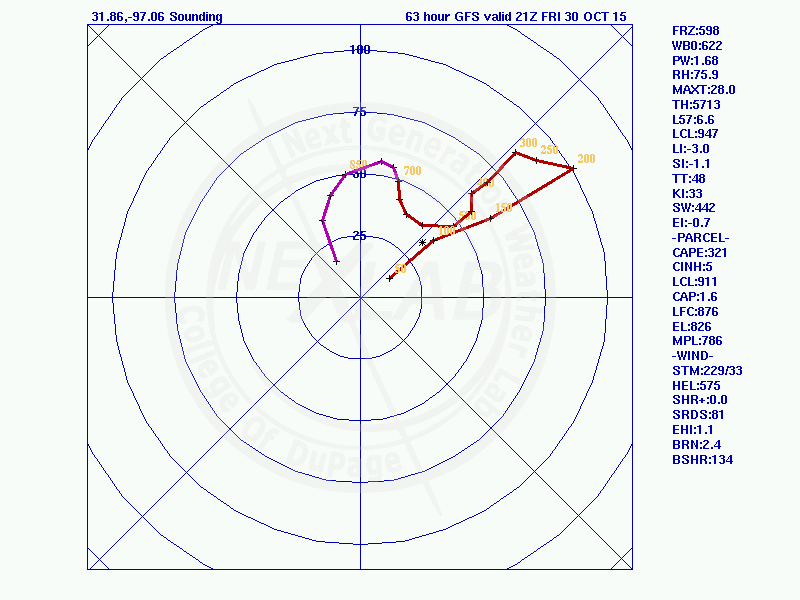
Without getting into all the nuts and bolts, the key thing about this image is the large circular shape in purple. This is the graph of the forecast lower level winds. The strength and shape of this curve indicates that at this time, (assuming that all other ingredients come in to play) that tornadoes are possible. Keep in mind that A LOT has to go right for tornadoes to develop - much the same way that in addition to flour, lots of ingredients have to come into play to make a cake.
As I mentioned before, this is just one slice on information from one specific weather model and is NOT meant the be an authoritative forecast. In fact, this is probably wishful thinking on my part and are a result of me wanting to chance some storms! While the wind shear, lift, and moisture look promising, the lack of instability may turn this whole event sour. Regardless, let's see how these ingredients shape up and keep an eye to my Faceook page for more up-to-date info!
-Andrew
Welcome to my blog! I hope to share some cool experiences with you about my love for weather - and if you learn something along the way - all the better. Thanks for visiting!
Showing posts with label thunderstorms. Show all posts
Wednesday, October 28, 2015
Monday, February 23, 2015
A Winter Storm in North Texas Brings Thundersleet!
The National Weather Service did an exceptional job forecasting a winter storm for the North Texas area over the last number of days. The primary hazards for this event were forecast to be freezing rain and sleet accumulations (as well as a phenomena known as thundersleet). As of 7 AM on Monday, February 23, 2015 (the day of the event), we already had approx. 1/4" of sleet accumulated at my house in Waxahachie, Texas
I've outlined what is known as a stable layer of air. Look at how the temperature rises with height. In other words, the air is getting warmer the higher you go within this layer. This means that air in the lower portions of the layer are colder and will not have a tendency to rise. This is called stable air. Above the stable layer, the temperature decreases with height. When you have cooler temperatures above and warmer air below, air has the tendency to rise and is therefore called unstable air. (Technically, this is called conditionally unstable air but there this should suffice for this post). As thunder comes about from convective (i.e. rising/sinking) motions of air, all thunderstorm activity would have to originate above this stable layer.
With me so far?
The last thunderstorm ingredient - lift - is a bit more complicated. In order to get parcels of air to form into thunderstorms, you need some kind of lifting mechanism. Typically this can be in the form of cold front or warm front. For this article, the lifting mechanism isn't important. However, the key is to look at the parcel after it has been lifted to see if it now stable or unstable.
I'm going to focus on the section above the stable layer as noted previously.
Forecasting winter weather is extremely tricky as there are MANY variables which come into play. Temperature fluctuations by a degree or two can have a huge impact on the amount and type of precipitation that may fall in a given area. This graphic, courtesy of the National Weather Service, briefly explains the differences in winter precipitation.
As sleet was falling around the majority of the Metroplex today, let's take a closer look at the atmosphere and see why this was so. To this end, let's bring up the sounding for the DFW area.
As I've eluded to numerous times in previous posts, a sounding is a graphical representation of the cross section of air starting at the surface and going as high as 15 km. The red line represents the observed temperature and the green line is the observed dewpoint. Also plotted (but not as important for this post) are wind speed and direction. Due to the proximity of the red and green lines in the bottom half of this sounding, it's reasonable to assume that there is some kind of precipitation going on. Why? When the temperature of air drops to the dew point, the air has cooled sufficiently to condense the water vapor present into water.
This next picture is zoomed into the bottom 9 km of the atmosphere. I've also noted (in light blue) the 0 degree temperature line. Note that this line isn't straight up and down - rather it's skewed to the right. Incidentally, this is why this diagram is also called a Skew-T (skewed temperature). This line becomes vitally important when looking at winter precipitation!
Starting at the 6 km altitude and moving downward, the sounding can be looked at in 3 sections. This will help us trace the precipitation path and determine its type.
6 km -3 km: This layer is most certainly precipitation as the temperature and dew point lines are nearly on top of each other. However, because all of this layer is below freezing (to the left of the 0 degree line), the precipitation being generated is most likely snow.
3 km - 1.5 km: The temperature and dew point lines are still very close which indicate precipitation. But this time, the entire layer is to the right of the 0 degree line. In other words, any snow falling through this layer is warmer than freezing and thus would be melting.
1.5 km - surface: As the water droplets continue to fall from a height of 1.5 km, the temperature once again drops back below freezing. Due to the thickness (height) of this layer, it seems likely that there's sufficient time for them to refreeze into sleet (ice pellets). If this layer had not been as deep, the next likely precipitation type would have been freezing rain.
A relatively rare phenomenon known as thundersleet also occurred today. Thundersleet is nothing more than sleet coming out of a thunderstorm. But how can there be thunderstorms when the surface temperature is below zero? In order to have a thunderstorm, you generally have to have 3 ingredients: moisture, instability and lift. I've already gone over the moisture component, so let's talk briefly about stability. Stability is a measure of the atmosphere's tendency to encourage or not encourage vertical motion. Let's take another look at the DFW sounding from this morning:
I've outlined what is known as a stable layer of air. Look at how the temperature rises with height. In other words, the air is getting warmer the higher you go within this layer. This means that air in the lower portions of the layer are colder and will not have a tendency to rise. This is called stable air. Above the stable layer, the temperature decreases with height. When you have cooler temperatures above and warmer air below, air has the tendency to rise and is therefore called unstable air. (Technically, this is called conditionally unstable air but there this should suffice for this post). As thunder comes about from convective (i.e. rising/sinking) motions of air, all thunderstorm activity would have to originate above this stable layer.
With me so far?
The last thunderstorm ingredient - lift - is a bit more complicated. In order to get parcels of air to form into thunderstorms, you need some kind of lifting mechanism. Typically this can be in the form of cold front or warm front. For this article, the lifting mechanism isn't important. However, the key is to look at the parcel after it has been lifted to see if it now stable or unstable.
I'm going to focus on the section above the stable layer as noted previously.
I've zoomed into this section of the sounding using another website.
What's cool about this website is that you can "lift" a parcel of air simply by clicking somewhere along the temperature curve. When I did this at a particular height (482 mb*), something interesting showed up.
(*mb refers to millibars - or atmospheric pressure - which is directly related to height in the atmosphere. The lower the millibar number, the lower the pressure and thus the higher in the atmosphere.)
When a parcel of air at the 482 mb level is lifted it technically becomes warmer than it's environment. Remember then what happens? It rises! It is this convective process that leads to storms and thunder! The lifted parcel's temperature is shown as the purple line in the image above. See how the parcel is warmer than the environmental temperature (red line)? This means that all along this pacel's ascent path it's rising due to the instability of the air. It eventually meets up again with the environmental temperature at which time it would stop rising. The area between the purple and red lines is called CAPE (Convective Available Potential Energy) and is a measure of how strong a thunderstorm can be. In this particular example, the CAPE value wasn't very strong and thus the thundersleet was not very widespread. It's also interesting to note that the 482 mb level wasn't the only height which generated CAPE values. There were other lotions where CAPE was present, but at lower amounts.
This was the end product of all the processes I've just discussed: Lightning (and thunder) as a result of elevated thunderstorms which produced snow that melted as it passed through a warm layer of the atmosphere and ultimately refroze while going through a subfreezing section of air before hitting the ground as sleet.
Subscribe to:
Posts (Atom)
.gif)


