Showing posts with label clouds. Show all posts

Wednesday, January 31, 2018

How I Measured The Height Of Clouds By Looking Out The Window

As I'm sitting down to write this, I realize that the last time I posted anything to this blog was December of 2015!  This was just after a series of deadly tornadoes ripped through North Texas the day after Christmas.  Since that time, I've learned a lot more about the weather have gone on a number of successful (and some not-so-successful) storm chases.  I started a small Facebook weather page too (innocently plugged here) to not only give people more info about weather for North Texas (sometimes Chicagoland and West Michigan too) but as another outlet for posting my weather photos.  Sure, posting pictures is fun and I'm going to continue to do that of course, but I still think that writing one's thoughts down after an experience like chasing or experiencing cool weather can really help to convey the emotions of what it was like to be there.  And of course, it can help others to learn and hopefully find the same excitement as me.   With that, here's to [hopefully] more posts!

I'll preface this article by saying that it's going to be SUPER NERDY.  I'm totally fine with that.  I've always been nerdy and I'm sure I always will be.  Oh..yeah - there's going to be some math (or "maths" as the British say) - but not too much I promise.  OK here goes:

I work for an architecture firm located in the West End of downtown Dallas.  We are currently constructing an expansion to our existing building.  It's fascinating to watch the progress to say the least.  As I was taking a short break from work this afternoon, I found myself looking out the window from my desk watching the flurry of construction activity below.  I quickly noticed something which instantly drew my attention away - clouds!  It's not like clouds are anything new, BUT we've been under a fairly dry weather pattern lately - so much so that clouds have been few and far between.  Some folks love that kind of weather.  Call me crazy, but I'm the opposite.  Give me clouds!  Give me storms!  Anytime I can look outside and see clouds, I'm happy.  But I wasn't expecting to see clouds today, except maybe a few cirrus here and there.  At this point you're thinking - wow! - those must be some cool clouds.  Well, no.  They weren't cool  There were just there.  I'm sure they were unnoticed by 99.9% of everyone else.  But they were there nonetheless!  And I saw them.  Here's was my view.  See them - waaayyy off in the distance....


Told you it was boring!  But it got me thinking - I wonder if I can see these on satellite?  You see, since my last post, a new weather satellite called GOES-16 has gone into operation.  This satellite is AWESOME - providing very high-resolution images in a much faster time than the previous generation of weather satellites.  It also can take 1-minute increment snapshots, giving a whole new way to experience cloud animations.  It's an amazing tool to say the least.  Pulling up the view for North Texas yielded this.


To the untrained eye, this may not look like much.  Here's an annotated version.


As you can see from my vantage point (near "DFW"), the clouds I saw were nearly to the Red River!!  This really surprised me.  I didn't think they would be that far north.  Naturally, that led me to my next question - how far away are they?  As you can see from the satellite picture, lakes around the DFW region show up dark - which means they can be very easily identified by their shape.  Assuming the clouds I photographed earlier were the same ones I circled above in yellow, then I determined that they were a bit further north of Lake Ray Roberts.  Thanks to Google Maps, it made measuring the distance pretty easy.


Based on the satellite view and Google Maps,  I estimated that the clouds in the picture were approximately 54 miles away.  But that's just in one direction.  I wondered if there was a way to calculate their heights?  This is where the math (and a little imagination) comes in!   Imagine if you will, 3 points in space - me (the observer), a point roughly 54 miles distant, and directly above that a point representing the clouds.  In essence what I've just described is a RIGHT TRIANGLE.  BINGO!  Can't see it?  Check this out....


In this view, my unknown value "X" is the height of the clouds.  This is what I need to solve for.  Given the 3 points I mentioned earlier, we can use trigonometry (more specifically the TANGENT operation) to estimate what the heights would be.  However I would still need to estimate one other piece of the equation - the angle of the clouds above the horizon - as seen from my perspective.  After looking up some crude ways of measuring degrees using my hands (I must have looked like a real tool holding out my hands toward the window!!!) I came up with my guess of 7 degrees.  I now had all I need to work out the problem.  Here's what I jotted down.


6.63 miles. This was my guess.  Was I right?  Beats me!!  I had no real way of knowing.  But like I was taught in school - go back to make sure your answer makes sense.  Ok.  Sure.  Um..how?   Oh yeah - SOUNDINGS!
I won't get into the nitty gritty of soundings here (I've written about them in previous posts) but I will briefly say that soundings are a tool which give a good idea of the vertical make up of the atmosphere by using a weather balloon to measure data like temperature, dewpoint, winds, etc. 

A few clicks later yielded this...


Remember that the bigger distance between the red (temperature) and green (dew point) lines, the drier the atmosphere is at that given point.  The above sounding indicates very dry air in place - much too dry to support clouds.  

BUT

Look here...


This is the area on the entire sounding where the 2 lines are closest - just above the 9 KM line and is the area where clouds would be most likely to be.  I switched over to the raw data view to see the numerical values which form the basis of these lines.  I was looking for the line which contained the smallest separation between the temperature and dewpoint - something called the dewpoint depression.


And there it is - 286 mb - or 9770 meters above the ground.  But how does that tie into my guess of 6.63 miles?  For that, it's just a matter of conversion:

My guess of the height of clouds:  6.63 miles = 10669.95 meters

Sounds data indicating likely area of clouds = 9770 meters

Difference?   900 meters.  Just under 1 KM!   WOW!  Not a bad guess overall for just looking out the window.  

-Andrew


Saturday, September 27, 2014

Altocumulus Castellanus Clouds - The Jellyfish of the Sky

One of the neat things about studying meteorology (and weather in general) is that sometimes you come across something very cool that most people would take for granted.  In my reading about different weather phenomenon a few weeks back, I ran across an article on something called Jellyfish Clouds.  These clouds are fairly rare and form when a layer of moist air rises upwards due to convection and becomes sandwiched between two layers of drier air.  Sometimes when these clouds form, they drop precipitation into the lower dry layer and it begins to evaporate.  The result is a cloud leaving a wispy tail below it which resembles it's namesake - a jellyfish!

On Friday, September 26, 2014, the drive home from work was pretty commonplace and uneventful.  A few miles away from home, I noticed some interesting clouds to my south (yes, I spend a lot of time looking UP at the sky when I probably should be looking at the road!).  Be that as it may, I finished my drive home and when I got into the driveway, I immediately shut off the car and snapped this picture:

 
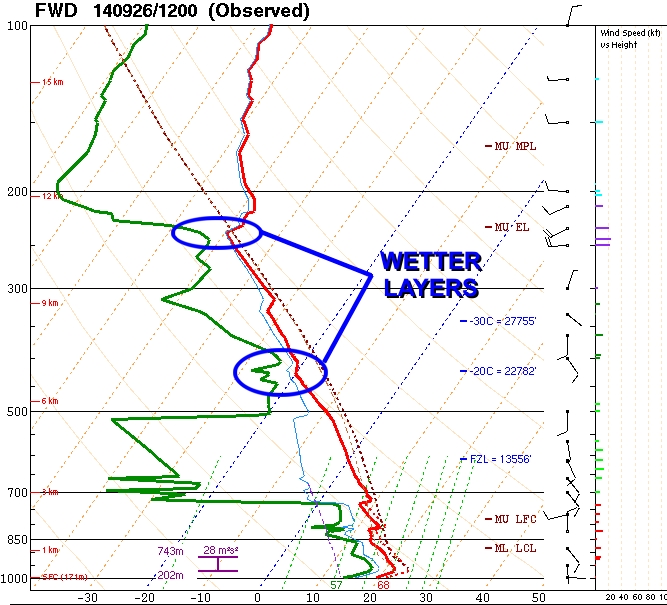
 I was pretty excited as these looked very much like the jellyfish clouds I had read about a few weeks prior.  However, I didn't want to make too much of it, so I decided to check the sounding data for that day to confirm my suspicions.  I've referred quite a bit to soundings in my previous posts, and it's a topic about which I solely need to devote a topic, but to briefly recap a sounding can be thought of as a cross section of the atmosphere from the ground level all the way up through the troposphere (the area of the atmosphere where all the weather takes place).  Soundings come out at 8AM and 8AM during daylight saving time (7AM and 7PM otherwise).  Data is generated by an instrument called a radiosonde which is attached to a weather balloon.  This instrument and balloon are released from National Weather Service offices all around the country and help meteorologists get an idea of the makeup of the atmosphere above.  They measure temperature, dew point, wind speed and direction.  It was about 6 PM when I arrived home, so the only thing I had at my disposal were the morning sounding.  Here's what it showed:


This graphic contains a TON of information, but the focus for the rest of this article will be on the upper left corner.  This plot - showing the red and green lines - is a graphical depiction of both the temperature (red line) and dew point (green line) starting at the surface (the bottom of the graphic) rising up to some 15-17 km (49,000 - 55,000 ft.) in the air.
 
The first thing you notice is that the red and green lines are fairly close together near the bottom.  The lowest layer - often referred to as the PBL, or Planetary Boundary Layer, shows that due to the proximity of the lines, there is a fair amount of humidity in the air.  Above the PBL, the green line veers sharply to the left.  This indicates that the next layer up is very dry.  Above that, it gets more humid, then dry again, then humid, then dry.  Who knew so much was going on above our heads!!  Here's a better explanation:


In these dry layers, no clouds can form as there is simply not enough moisture.  However, when the lines get close, this indicates that there is sufficient humidity for clouds to form.  In fact, depending on where the layers are, you get different types of clouds!


Remember above when I said that jellyfish (altocumulus) clouds form in a moist layer which is sandwiched between two drier layers?  Well, this is exactly what we had in the atmosphere that day.  In other words, this did confirm to me that, yes, what I had captured earlier were the elusive jellyfish clouds!  From the morning sounding it looks like they were forming above the 6 km (~19,000 ft) mark.  The precipitation which was dropping from them fell into a very dry layer below 6 km.  This was the cause of the wisps beneath the clouds.
 
When the evening soundings were posted, I checked those one last time to see if the data would still support my findings.  Sure enough, although it was quickly drying out, the comparatively humid layer above 6 km was still present.  As I write this article, I'm still jazzed that I was able to capture a fairly rare phenomenon.  Can't wait until the next occurrence!!


BUT WAIT!  For those of you who haven't dozed off yet, you may have noticed that altocumulus clouds formed in a region where the air temperature is -20 C (-4 F).  How is this possible to have liquid water exist at a temperature below freezing??  Well, believe it or not, this is a process called supercooling and involves a whole branch of could physics (yes, there is such a thing).  This, however, would require it's own article......
 
-Andrew